The table below shows the inflation rate for the period 2005 through 2010.Suppose you wanted to show that there was not much variation in the inflation rate over this period.How would you represent this table in a graph? Suppose you wanted to show that there was a large amount of variation during this period.How would you represent this table in a graph? 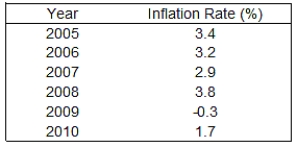
Definitions:
Push System
A type of inventory control system where products are manufactured or acquired based on forecasted demand, pushing products towards the consumer without immediate demand signals.
JIT
Just-In-Time, a production strategy aimed at reducing in-process inventory and associated carrying costs by producing and delivering products just as they are needed.
Service Organizations
Entities that primarily offer intangible goods to consumers through the provision of services instead of physical products.
Competitive Advantage
The attributes that allow an organization to outperform its competitors, such as cost, product differentiation, and market access.
Q10: According to Exhibit 2A-1,in 2008 the<br>A)inflation rate
Q19: The first theorem of welfare economics states
Q32: If market demand increases,a competitive firm sees<br>A)its
Q56: A price shock occurs when<br>A)the monetary policy
Q57: The IA line will move down if<br>A)potential
Q64: Suppose the economy is initially at point
Q83: How is information conveyed from one individual
Q85: Suppose an economy existed in which investment,net
Q96: President Bill Clinton's 1994 Economic Report presented
Q128: Suppose the average total cost curves for