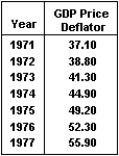
The figure below plots real and potential GDP between 1971 and 1977.Given the data in the corresponding table,can changes in the rate of inflation over this period be explained by the percent deviation between real and potential GDP? Do these data support or refute the validity of the assumptions about the IA line? 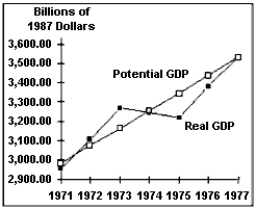
Definitions:
Self-Interest
The consideration of one's personal benefit or advantage, especially when pursued without regard to others.
Economic Duress
Involves a situation where a party is forced into an agreement through wrongful economic pressure or threats, compromising their free will.
Employment Contract
A formal agreement between an employer and an employee that outlines the terms of employment, including duties, salary, and duration.
Unemployed
Refers to individuals who are without a job but are available for and seeking employment.
Q7: Suppose the value of one variable rises
Q33: In practice,automatic fiscal policy has helped stabilize
Q40: An increase in real interest rates leads
Q64: In 1986 the debt to GDP ratio
Q67: Industry expansion cannot occur without firms entering
Q89: Which of the following is true?<br>A)The Fed
Q95: External diseconomies of scale cause an industry's
Q142: Explain why the interest rate is the
Q159: Which of the following would likely result
Q175: When inflation increases,<br>A)the Fed lowers interest rates