The following table gives a numerical example of the inflation adjustment line in the year 2007. 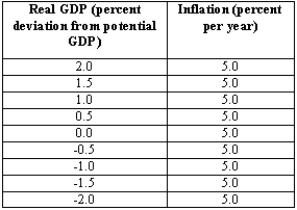 (A)Sketch the line in a graph.
(B)If real GDP is below potential GDP in the year 2007,will the inflation adjustment line shift up or down in the year 2008?
(C)In the same graph as part (A),sketch an aggregate demand curve.Find the equilibrium level of inflation and real GDP in the year 2008.
(D)What will happen to the inflation adjustment line if oil prices suddenly increase?
Definitions:
Major League Baseball
A professional baseball organization that is the oldest of the four major professional sports leagues in the United States and Canada.
OPEC
The Organization of the Petroleum Exporting Countries, a group of oil-producing nations that coordinates and unifies petroleum policies.
Output Market
The marketplace in which final goods or services are offered to consumers, businesses, and other entities.
Output Effect
A phenomenon where changes in price level influence the quantity of goods and services produced in an economy due to the alteration in profitability of goods sold.
Q33: In the long run,firms enter an industry
Q42: When interest rates increase,<br>A)government purchases will increase
Q49: Which of the following is
Q60: The symbol G used throughout the text
Q103: One type of private security held by
Q116: Suppose a dentist has total revenue of
Q129: Suppose a competitive industry is in long-run
Q148: Suppose the economy is in a boom
Q168: Historically,there has been a positive correlation between
Q174: Which of the following statements are true,and