The figure below shows the effect of a 2001 increase in government purchases on the hypothetical path of real GDP compared to the path of potential GDP (the baseline)between 2001 and 2005. 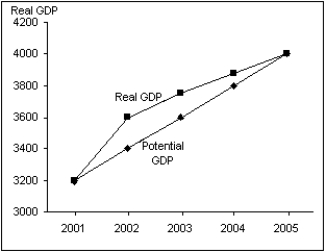 (A)Using the AD curve and IA line analysis,explain what is occurring between 2001 and 2002.
(B)Using the AD curve and IA line analysis,explain what is occurring between 2002 and 2004.
(C)Using the AD curve and IA line analysis,explain what is occurring between 2004 and 2005.
Definitions:
Monopolized
A market condition where a single entity controls the entire supply of a product or service, eliminating competition.
Simultaneous Game
A strategic situation where all players make their decisions at the same time without knowledge of the others' choices.
Equilibrium
A state in a market or economy where supply and demand are balanced, leading to stable prices and quantities.
Sequential Game
A type of game in game theory where players make moves one after another rather than simultaneously.
Q5: Which of the following is probably the
Q27: The slope of the monetary policy rule
Q31: Economic fluctuations in the United States during
Q43: Unlike the demand for bananas in a
Q60: In the long run,market supply increases as
Q67: In the last two and a half
Q87: Suppose,for a certain economy,real and potential GDP
Q93: The global financial crisis that began in
Q111: A temporary growth slowdown results in a<br>A)disinflation.<br>B)deflation.<br>C)boom.<br>D)fall
Q150: When the rate of inflation rises,the central