Essay
The table below shows the percentage difference between real and potential GDP and the rate of inflation for the years 1999 through 2003.If there were a presidential election in the year 2000,would these data support the view that there was a political business cycle during this period? 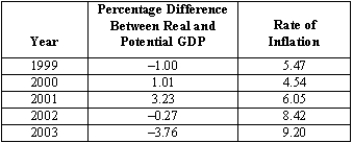
Definitions:
Related Questions
Q34: Suppose a recession occurs unexpectedly in December
Q48: The effect of an increase in a
Q49: Which of the following would lead to
Q50: Which of the following is considered a
Q78: The U.S.federal budget is a major summary
Q81: When the government imposes a tariff,the<br>A)import demand
Q95: Data for the states within the United
Q98: Quantitative easing is one way to stimulate
Q102: The share of 2003 world GDP accounted
Q163: A change in the price of a