Multiple Choice
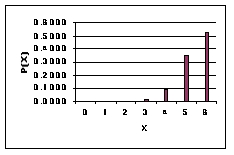
The following graph is a binomial distribution with n = 6.  This graph reveals that ____________.
Definitions:
Related Questions
Q8: Flaherty Corporation used data for 3 years
Q15: An outlier of a data set is
Q16: According to the central limit theorem,if a
Q22: Normal distribution is a symmetrical distribution with
Q23: A hypergeometric distribution applies to experiments in
Q33: Scholastic Aptitude Test scores are an example
Q37: The staff of Ms.Tamara Hill,VP of Technical
Q73: Calculate the percent increase or decrease for
Q111: The greater the times interest earned ratio,
Q116: Refer to the following selected financial information