Investigators gave caffeine to fruit flies to see if it affected their rest. The four treatments were a control, a low caffeine dose of 1 mg/ml of blood, a medium dose of 3 mg/ml of blood, and a higher caffeine dose of 5 mg/ml of blood. Twelve fruit flies were assigned at random to the four treatments, three to each treatment, and the minutes of rest measured over a 24-hour period were recorded. Assume the data that follow are four independent SRSs (one from each of the four populations of caffeine levels) and that the distribution of the yields is Normal. 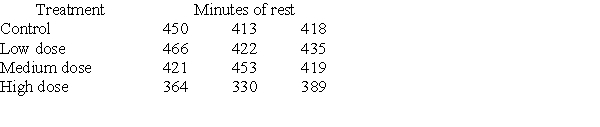 A partial ANOVA table produced by Minitab follows, along with the means and standard deviation of the yields for the four groups.
 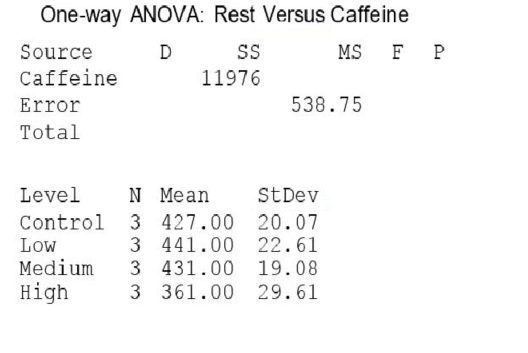 The pooled standard deviation is:
Definitions:
Q1: The purpose of studying statistics is to:<br>A)gain
Q2: In the audit of cash,the auditor obtains
Q3: Which of the following might cause undercoverage
Q15: Which of the following statements is true
Q19: The bank confirmation provides the most evidence
Q31: The following is a sample of the
Q39: Advice columnist Ann Landers once asked her
Q68: Which of the following is most likely
Q152: Inflation reduction has the lowest cost when
Q223: In response to recession, who primarily raised