The following histogram represents the distribution of acceptance rates (percent accepted) among 25 business schools in 2004. In each class interval, the left endpoint but not the right is included, so the class intervals are 10 rate < 15, 15 rate < 20, etc. 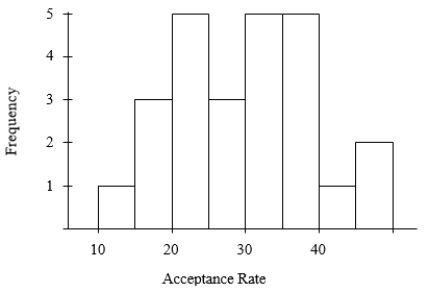 What is the median acceptance rate?
Definitions:
Prediction Error
The difference between the observed values and the values predicted by a model.
Absolute Value
The non-negative value of a number without regard to its sign; essentially, it's the distance of a number from zero on the real number line.
Correlation
Correlation is a statistical measure that expresses the extent to which two variables fluctuate together, showing the strength and direction of their relationship.
Scatter Plot
A type of graph or plot which uses Cartesian coordinates to display values for typically two variables for a set of data.
Q7: A study of obesity risk in children
Q7: The following table describes the opinions of
Q17: The use of positive confirmations provides better
Q21: Auditors on staff in the Office of
Q23: Forensic accounting does not include fraud auditing.
Q37: Student ages (to the nearest year) in
Q39: A violin student records the number of
Q48: According to the M&Ms Web site, each
Q118: "Leaning against the wind" is exemplified by
Q206: If tax rates are raised to avoid