Multiple Choice
The stemplot below displays midterm exam scores for 34 students taking a calculus course. The highest possible test score was 100. The teacher declared that an exam grade of 65 or higher was good enough for a grade of C or better. 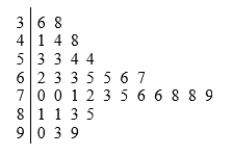 This stemplot is most similar to:
Definitions:
Related Questions
Q7: Each month, the census bureau mails survey
Q20: Suppose we toss a fair coin repeatedly.
Q23: Enteroliths are calcifications that form in the
Q49: Social Security transfers wealth from younger generations
Q133: Refer to figure 17-7. Suppose the economy
Q181: Refer to Figure 17-6. Starting from C
Q183: Which of the following is correct?<br>A) No
Q229: If people in a country that has
Q248: In the long run, an increase in
Q363: Milton Friedman argued that the Fed's control