Figure 12-3. On the graph, MS represents the money supply and MD represents money demand. The usual quantities are measured along the axes.
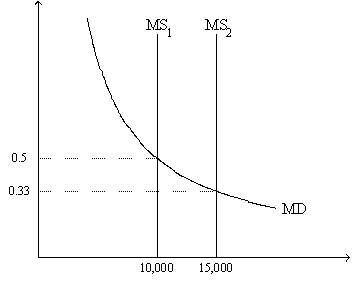
-Refer to Figure 12-3. Suppose the relevant money-supply curve is the one labeled MS2; also suppose the economy's real GDP is 45,000 for the year. If the money market is in equilibrium, then the velocity of money is approximately
Definitions:
Government Unit
An organizational entity of the government responsible for specific administrative functions at local, state, or national levels.
Chief Financial Officers
Senior executives responsible for managing the financial actions of a company, including financial planning and report tracking.
Financial Statements
Documents that present the financial activities and condition of a business or entity, including the balance sheet, income statement, and cash flow statement.
Chief Operating Officers
High-ranking executives responsible for overseeing the day-to-day administrative and operational functions of a company.
Q14: To explain the long-run determinants of the
Q163: Which of the following costs of inflation
Q165: The set of items that serve as
Q194: If the real exchange rate between the
Q245: Other things the same, an increase in
Q254: By itself, when a Japanese bank purchases
Q315: A country has $60 million of saving
Q325: When we measure and record economic value,
Q330: When the price level falls, the number
Q331: A U.S. pharmacy buys drugs from a