Figure 9-1. The figure shows a utility function.
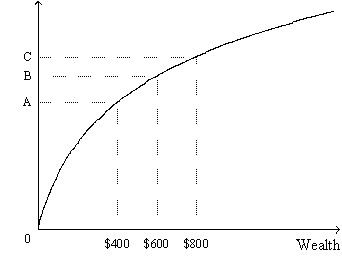
-Refer to Figure 9-1. Which distance along the vertical axis represents the marginal utility of an increase in wealth from $600 to $800?
Definitions:
Graphical Origin
The point on a graph where the x-axis and y-axis intersect, typically representing the zero point for both axes.
Feasible Region
In optimization problems, the set of all possible points that satisfy the constraints, representing solutions that meet the problem's criteria.
Constraints
Limitations or restrictions that impact the options available for decision-making or problem-solving.
Linear Programming
A mathematical methodology for optimizing a linear objective function, subject to linear equality and linear inequality constraints.
Q11: Refer to Table 8-2. Which company had
Q143: At which interest rate is the present
Q214: A car salesperson gives you four alternative
Q253: Manufacturers of Weightbegone are concerned that genetic
Q255: A creditor of a corporation holds<br>A) bonds
Q272: After a corporation issues stock, the stock<br>A)
Q308: Demonstrate that whether you would prefer to
Q346: A risk-averse person has<br>A) a utility function
Q365: Suppose the interest rate is 7 percent.
Q442: Suppose that telemarketers are not unionized. If