Multiple Choice
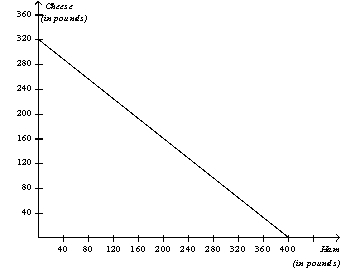
Figure 3-11
The graph below represents the various combinations of ham and cheese (in pounds) that the nation of Bonovia could produce in a given month.

-Refer to Figure 3-11.For Bonovia,what is the opportunity cost of a pound of cheese?
Definitions:
Related Questions
Q29: Differences in scientific judgement between economists is
Q45: You have been asked by your economics
Q47: Refer to Table 3-7. Korea should specialize
Q142: Refer to Figure 2-3. At which point
Q231: Julia can fix a meal in 1
Q278: For international trade to benefit a country,
Q385: Refer to Table 3-4. The rancher has
Q398: Production possibilities frontiers are usually bowed outward.
Q474: The y-coordinate of an ordered pair specifies
Q506: A survey of professional economists revealed that