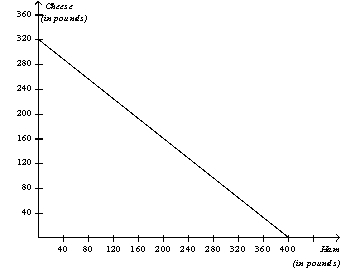
Figure 3-11
The graph below represents the various combinations of ham and cheese (in pounds) that the nation of Bonovia could produce in a given month.

-Refer to Figure 3-11.The nation of Cropitia has a comparative advantage over Bonovia in producing ham if
Definitions:
Nominal Interest Rate
The interest rate which is advertised or stated, without adjustment for the full effects of compounding or inflation.
Semiannual Compounding
The process of applying interest to a principal sum twice a year, leading to interest being earned on interest.
Periodic Interest Rate
The interest rate applied over a specific time period, crucial for calculating interest in savings and loan scenarios.
Present Value
The value today of a future amount of money or sequence of cash payments, calculated using a designated return rate.
Q90: Refer to Figure 3-10. If point A
Q96: Refer to Table 3-6. The opportunity cost
Q182: The first number in any ordered pair
Q218: Both Bill and Mary produce t-shirts and
Q224: If a higher price means a greater
Q254: Economists regard events from the past as<br>A)
Q326: Refer to Figure 3-5. If Hosne and
Q376: Ben bakes bread and Shawna knits sweaters.
Q396: Refer to Table 3-10. Juanita's opportunity cost
Q495: Refer to Figure 4-19. All else equal,