Consider the following to answer the question(s) below:
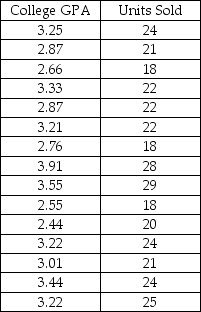
A sales manager was interested in determining if there is a relationship between college GPA and sales performance among salespeople hired within the last year. A sample of recently hired salespeople was selected and the number of units each sold last month was recorded. Relevant data appear in the table below.
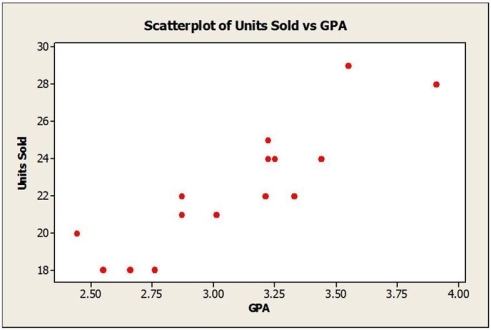
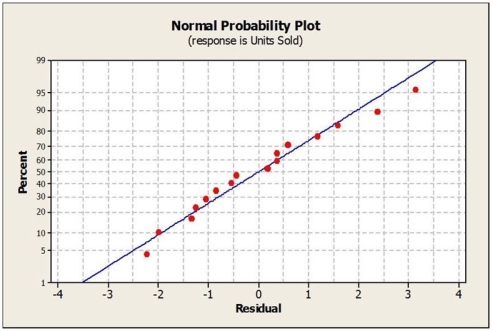
 Below are the scatterplot, regression results, and residual plots for these data.
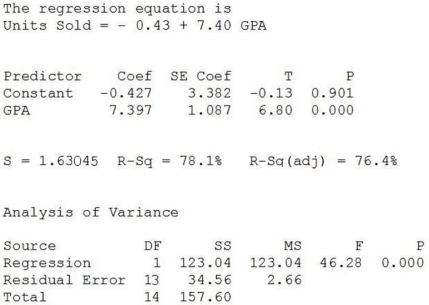
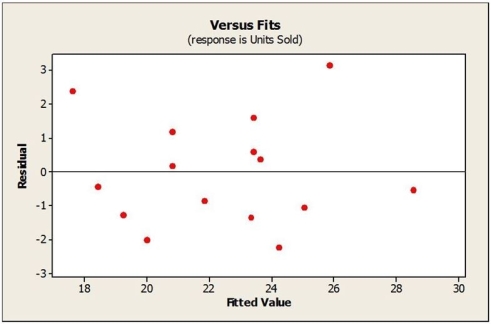
-The confidence interval and prediction interval for the number of units sold per month when GPA = 3.00 are shown below. Interpret both intervals in this context.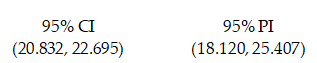
Definitions:
Q2: Below is a stem-and-leaf display of prices
Q3: Which of the following is true?<br>A) The
Q5: The boxplots show monthly sales revenue figures
Q8: A sample of firms was selected from
Q11: The produce manager for a local Sobey's
Q25: All else being equal, increasing the level
Q26: Peter plans to sell his two houses,
Q27: Consumer Reports Health routinely compares drugs in
Q33: The calculated t-statistic to test whether the
Q50: What was a result of the development