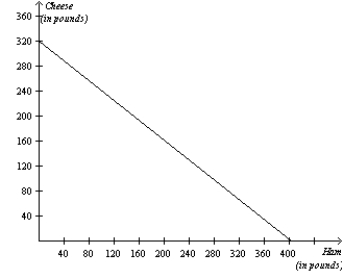
Figure 3-23
The graph below represents the various combinations of ham and cheese (in pounds) that the nation of Bonovia could produce in a given month. 
-Refer to Figure 3-23.For Bonovia,what is the opportunity cost of a pound of cheese?
Definitions:
Fixed Costs
Expenses that remain constant regardless of the amount of output or sales, like lease payments, wages, and premiums.
Peak-period Capacity
The maximum output a business can produce in a short period when demand is the highest, often requiring efficient use of resources.
Fabrication Department
A specialized section of a manufacturing company where raw materials are assembled, shaped, or processed into finished goods.
Logistics Department
A segment within a company responsible for managing the efficient flow of goods, services, and information from point of origin to point of consumption to meet customer requirements.
Q39: Refer to Table 4-6. If these are
Q58: Refer to Table 4-4. Suppose the market
Q160: The opportunity cost of something is what
Q188: Refer to Figure 3-11. If the production
Q215: The law of demand states that, other
Q291: "Minimum wage laws result in unemployment" is
Q294: Refer to Figure 2-23. The opportunity cost
Q344: Refer to Table 3-40. Italy should specialize
Q511: Refer to Table 3-40. Germany should specialize
Q564: Which of the following would not shift