Figure 26-4. On the horizontal axis of the graph, L represents the quantity of loanable funds in billions of dollars. 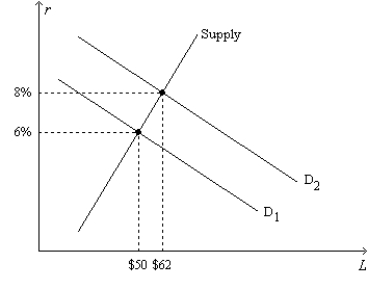
-Refer to Figure 26-4. Regard the position of the Supply curve as fixed, as on the graph. If the real interest rate is 8 percent, the inflation rate is 3 percent, and the market for loanable funds is in equilibrium, then the position of the demand-for-loanable-funds curve must be
Definitions:
Consume Goods
The act of using up goods and services for personal needs or consumption.
Save Money
The practice of reducing expenditures or setting aside funds to increase financial security or for future use.
Net Present Value
Net Present Value (NPV) is a financial metric that calculates the present value of all cash flows associated with a project, including both inflows and outflows, to determine its profitability.
Interest Rate
The percentage at which interest is paid by a borrower for the use of money that they borrow from a lender.
Q39: What is the present value of a
Q76: Nastech Pharmaceuticals announced it has developed a
Q173: Which of the following is not correct?<br>A)
Q279: Is physical capital a produced factor of
Q299: In a closed economy, public saving is
Q361: If the quantity of loanable funds supplied
Q393: An increase in the demand for loanable
Q427: If the interest rate is 4 percent,
Q480: The problem of moral hazard arises because<br>A)
Q484: An increase in the demand for loanable