Multiple Choice
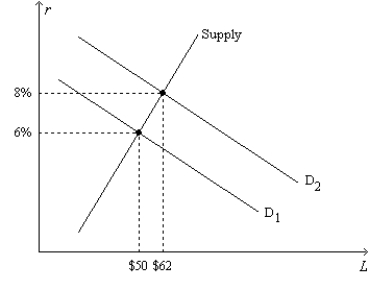
Figure 26-4.On the horizontal axis of the graph,L represents the quantity of loanable funds in billions of dollars. 
-Refer to Figure 26-4.If the equilibrium quantity of loanable funds is $56 billion and if the rate of inflation is 5 percent,then the equilibrium nominal interest rate is
Definitions:
Related Questions
Q26: Suppose you put $500 into a bank
Q87: In a closed economy, if Y is
Q157: What is the present value of a
Q232: People who buy stock in a corporation
Q250: Retained earnings are<br>A) earnings of a company
Q470: One reason that governments may find it
Q477: Compared to short-term bonds, other things the
Q482: Diminishing marginal utility of wealth implies that
Q526: If the tax rate fell, holding municipal
Q544: If the quantity of loanable funds demanded