Figure 30-2. On the graph, MS represents the money supply and MD represents money demand. The usual quantities are measured along the axes. 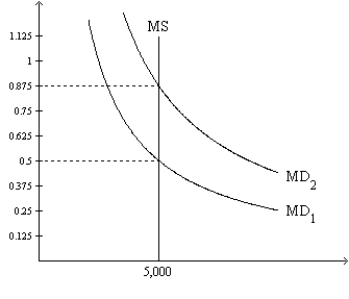
-Refer to Figure 30-2. At the end of 2009 the relevant money-demand curve was the one labeled MD2. At the end of 2010 the relevant money-demand curve was the one labeled MD1. Assuming the economy is always in equilibrium, what was the economy's approximate inflation rate for 2010?
Definitions:
Quantity Supplied
The amount of a good or service that producers are willing and able to sell at a particular price over a given period of time.
Marginal Revenue
The extra revenue gained by the sale of an additional unit of a product or service.
Total Revenue
The total amount of income generated by the sale of goods or services by a company.
Average Cost
The total cost of production divided by the quantity of output produced, representing the cost per unit of output.
Q41: In which case is velocity the highest?<br>A)
Q128: Refer to Table 29-7. If the Fed
Q198: Which of the following is not correct?<br>A)
Q238: Refer to Table 29-8. The required reserve
Q257: Suppose every good costs $8 per unit
Q259: The Fisher effect says that<br>A) the nominal
Q303: Given a nominal interest rate of 8
Q366: Just after the terrorist attack on September
Q424: If the real interest rate is 5%
Q459: The source of all four classic hyperinflations