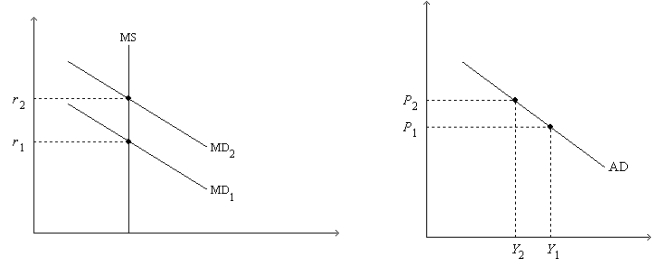
Figure 34-2. On the left-hand graph, MS represents the supply of money and MD represents the demand for money; on the right-hand graph, AD represents aggregate demand. The usual quantities are measured along the axes of both graphs.

-Refer to Figure 34-2. Assume the money market is always in equilibrium, and suppose r1 = 0.08; r2 = 0.12; Y1 = 13,000; Y2 = 10,000; P1 = 1.0; and P2 = 1.2. Which of the following statements is correct?
Definitions:
Q24: When the money supply decreases<br>A) interest rates
Q128: In order to simplify the equation for
Q128: Refer to Figure 35-1. Assuming the price
Q154: Suppose that there is an increase in
Q238: Suppose the Federal Reserve lowers the target
Q248: Which of the following shifts both the
Q254: Which of the following is likely more
Q296: Refer to Pessimism. Which curve shifts and
Q318: An increase in the expected price level
Q346: An increase in the money supply causes