Figure 34-6. On the left-hand graph, MS represents the supply of money and MD represents the demand for money; on the right-hand graph, AD represents aggregate demand. The usual quantities are measured along the axes of both graphs.
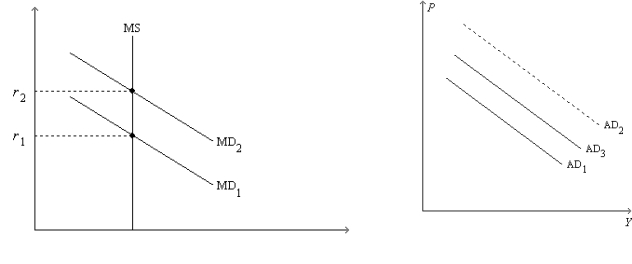
-Refer to Figure 34-6. Suppose the graphs are drawn to show the effects of an increase in government purchases. If it were not for the increase in r from r1 to r2, then
Definitions:
Conditioned Response
A response that is acquired after a previously neutral stimulus becomes linked with a stimulus that naturally induces a reaction.
Extinction
In behavior psychology, the gradual weakening and eventual disappearance of a conditioned response tendency.
Cravings
Intense desires or urges for specific substances or experiences, often associated with addiction and withdrawal.
Quit Smoking
The process of stopping the habit of smoking tobacco products, often involving withdrawal symptoms and requiring significant effort and support.
Q15: When Congress reduces spending in order to
Q84: According to liquidity preference theory,<br>A) an increase
Q117: The multiplier effect<br>A) and the crowding-out effect
Q207: Refer to Figure 35-6. If the economy
Q255: Refer to Figure 34-4. Suppose the current
Q320: Figure 33-16. <img src="https://d2lvgg3v3hfg70.cloudfront.net/TB4802/.jpg" alt="Figure 33-16.
Q355: Suppose people anticipate an increase in the
Q385: As aggregate demand shifts left along the
Q479: If the Fed conducts open-market sales, which
Q546: Make a list of expenditures whose sum