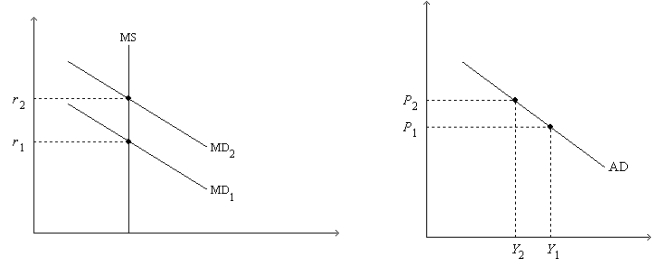
Figure 34-2. On the left-hand graph, MS represents the supply of money and MD represents the demand for money; on the right-hand graph, AD represents aggregate demand. The usual quantities are measured along the axes of both graphs.

-Refer to Figure 34-2. As we move from one point to another along the money-demand curve MD1,
Definitions:
Leadership Process
A series of actions or steps taken to guide and direct a group towards achieving a common goal.
Communication Issues
Challenges or problems encountered in the exchange of information between individuals or groups.
Basic Communication Conventions
Fundamental rules and norms that guide the process of exchanging information effectively and appropriately.
Giving Opinions
The act of expressing personal beliefs, feelings, or thoughts on a subject or topic.
Q18: Other things the same, an increase in
Q31: Which of the following claims concerning the
Q50: Suppose businesses in general believe that the
Q183: Refer to Figure 33-4. The economy would
Q215: If the MPC is 5/6 then the
Q308: The downward slope of the aggregate demand
Q372: Other things the same, continued increases in
Q383: Other things the same, if the price
Q399: Suppose a stock market crash makes people
Q499: A change in the expected price level