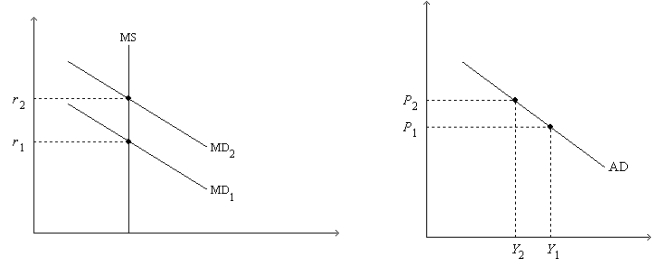
Figure 34-2. On the left-hand graph, MS represents the supply of money and MD represents the demand for money; on the right-hand graph, AD represents aggregate demand. The usual quantities are measured along the axes of both graphs.

-Refer to Figure 34-2. Assume the money market is always in equilibrium, and suppose r1 = 0.08; r2 = 0.12; Y1 = 13,000; Y2 = 10,000; P1 = 1.0; and P2 = 1.2. Which of the following statements is correct?
Definitions:
Homozygous Genotype
A genetic condition where an individual has two identical alleles for a particular trait.
AA
A common abbreviation for amino acids, which are the building blocks of proteins in biology.
Aa
Refers to the genotype consisting of one dominant allele and one recessive allele for a particular gene, resulting in an intermediate phenotype in incomplete dominance.
Task Progress Reports
Documents or updates that outline the current status, achievements, and impending tasks related to a specific project or activity.
Q13: Opponents of active stabilization policy<br>A) generally don't
Q149: In the short run,<br>A) the price level
Q166: If policymakers decrease aggregate demand, then in
Q201: Which of the following can explain the
Q301: The sticky-wage theory of the short-run aggregate
Q367: Other things the same, if prices fell
Q387: Other things the same, the aggregate quantity
Q418: A surplus or shortage in the money
Q441: A change in the money supply changes
Q443: When monetary and fiscal policymakers expand aggregate