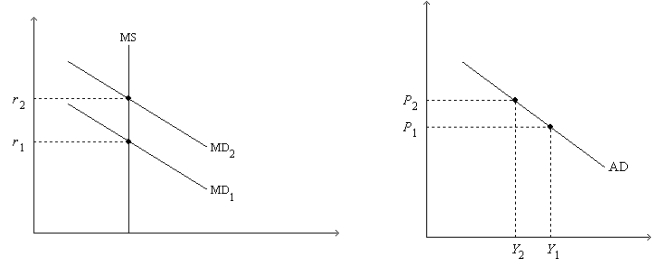
Figure 34-2. On the left-hand graph, MS represents the supply of money and MD represents the demand for money; on the right-hand graph, AD represents aggregate demand. The usual quantities are measured along the axes of both graphs.

-Refer to Figure 34-2. Assume the money market is always in equilibrium, and suppose r1 = 0.08; r2 = 0.12; Y1 = 13,000; Y2 = 10,000; P1 = 1.0; and P2 = 1.2. Which of the following statements is correct? When P = P2,
Definitions:
Antibias Curriculum
An educational framework designed to combat biases and promote understanding and respect among people of different backgrounds.
Equitable Society
A concept or vision of a society in which fairness and justice guide the distribution of opportunities, rights, and responsibilities.
Cognitive Approach
A psychological viewpoint that focuses on understanding how people process, store, and retrieve information and how this affects behavior.
Teaching Tool
Any item, strategy, or method used to convey knowledge or facilitate learning.
Q35: The ease with which an asset can
Q89: Increased uncertainty and pessimism about the future
Q106: Samuelson and Solow argued that when unemployment
Q110: If aggregate demand shifts right, then eventually
Q234: A.W. Phillips found a<br>A) positive relation between
Q271: Refer to Figure 34-14. Households' desired money
Q339: When the price level rises more than
Q443: When monetary and fiscal policymakers expand aggregate
Q521: Figure 33-15. <img src="https://d2lvgg3v3hfg70.cloudfront.net/TB4802/.jpg" alt="Figure 33-15.
Q545: The aggregate demand and aggregate supply model