Figure 34-6. On the left-hand graph, MS represents the supply of money and MD represents the demand for money; on the right-hand graph, AD represents aggregate demand. The usual quantities are measured along the axes of both graphs.
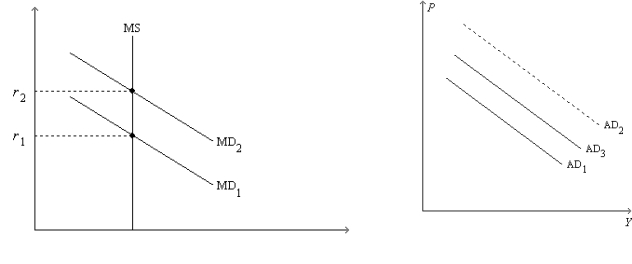
-Refer to Figure 34-6. Suppose the multiplier is 3 and the government increases its purchases by $25 billion. Also, suppose the AD curve would shift from AD1 to AD2 if there were no crowding out; the AD curve actually shifts from AD1 to AD3 with crowding out. Finally, assume the horizontal distance between the curves AD1 and AD3 is $40 billion. The extent of crowding out, for any particular level of the price level, is
Definitions:
Total Revenue
The total amount of money earned from the sale of goods or services before deducting any costs.
Price
The sum of money needed to buy a product or service.
Inelastic
A description of a product's demand when its price elasticity is less than one, indicating that demand is relatively unresponsive to price changes.
Price
The cash amount projected, required, or delivered in settlement for something.
Q5: Policymakers use _ policy and _ policy
Q41: Keynes argued that aggregate demand is<br>A) stable,
Q61: If the Federal Reserve decreases the money
Q166: Some economists argue that<br>A) monetary policy should
Q231: Any policy change that reduced the natural
Q248: The equation, Unemployment rate = Natural rate
Q296: Refer to Pessimism. Which curve shifts and
Q449: Refer to Figure 35-4. Assume the figure
Q550: Which of the following shifts short-run aggregate
Q552: A decrease in the expected price level