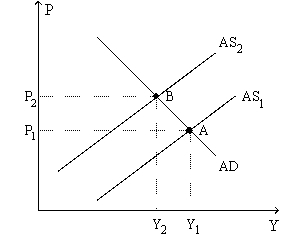
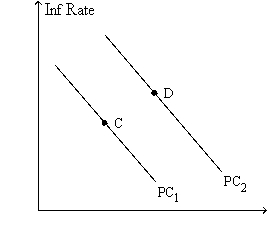
Figure 35-9. The left-hand graph shows a short-run aggregate-supply SRAS) curve and two aggregate-demand AD) curves. On the right-hand diagram, "Inf Rate" means "Inflation Rate." 

-Refer to Figure 35-9. Faced with the shift of the Phillips curve from PC1 to PC2, policymakers will
Definitions:
Q176: During recessions, unemployment insurance payments tend to
Q221: Which of the following reduce the incentive
Q233: Time inconsistency will cause the<br>A) short-run Phillips
Q272: The Fed raised interest rates in 2004
Q293: As compared to a tax cut, an
Q303: Suppose a central bank takes actions that
Q337: The experience of the Volcker disinflation of
Q400: Are the effects of an increase in
Q499: If businesses and consumers become pessimistic, the
Q503: On a given short-run Phillips curve which