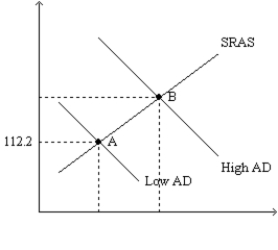
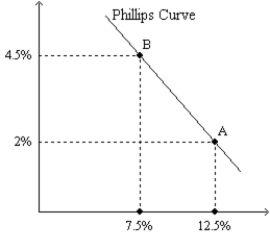
Figure 35-4.The left-hand graph shows a short-run aggregate-supply (SRAS) curve and two aggregate-demand (AD) curves.On the left-hand diagram,the price level is measured on the vertical axis;on the right-hand diagram,the inflation rate is measured on the vertical axis. 

-Refer to Figure 35-4.What is measured along the horizontal axis of the left-hand graph?
Definitions:
Self-Fulfilling Prophecy
What occurs when a person acts in ways that confirm another’s expectations.
Different Assumptions
The varying underlying beliefs or ideas that individuals or groups hold, which can influence perceptions, decisions, and behaviors in diverse contexts.
Hawthorne Studies
A series of experiments conducted in the 1920s and 1930s that revealed the importance of social relations and worker satisfaction in the workplace.
Conclusion
The end or final part of something, such as a document or project, often summarizing the key points or outcomes.
Q160: What would a central bank need to
Q183: If the investment accelerator from an increase
Q189: When taxes increase, the interest rate<br>A) increases,
Q195: In the long run, an increase in
Q234: A.W. Phillips found a<br>A) positive relation between
Q282: The theory of liquidity preference illustrates the
Q348: Stimulus spending in 2009 was used for<br>A)
Q405: Refer to Figure 35-7. The economy would
Q467: An aide to a U.S. Congressman computes
Q480: In the long run, a decrease in