Multiple Choice
The graph shows the temperature T, in degrees Fahrenheit, of molten glass t seconds after it is removed from a kiln. 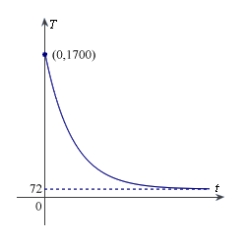 Find
Find  .
.
Definitions:
Related Questions
Q1: Set up and evaluate integrals for finding
Q3: If the annual rate of inflation averages
Q5: Use the differential equation <img src="https://d2lvgg3v3hfg70.cloudfront.net/TB4584/.jpg" alt="Use
Q8: Assume that the amount of money deposited
Q9: Find the value of the derivative (if
Q11: Find the constant a such that the
Q14: Use integration to find a general solution
Q17: Write an equation of the line that
Q17: Use integration to find a general solution
Q18: Find the volume of the solid generated