Annual estimates of the population in a certain city from 2004 (t = 1) onward are shown in the time series graph below. 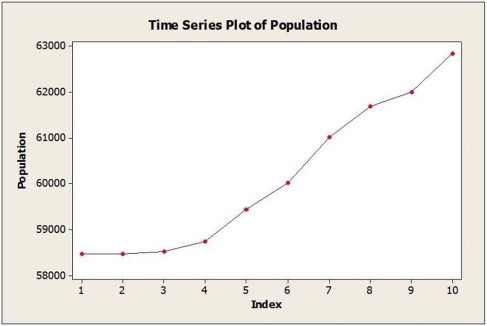 a. Identify the dominant time series component(s) in the data.
b. Below are the results from fitting a linear trend model to the data. Use this model to estimate the population in this city for 2014 (t = 11).
Fitted Trend Equation  , = 57,206 + 528t
c. Below are the results from fitting a quadratic trend model to the data. Use this model to estimate the population in this city for 2014 (t = 11).
Fitted Trend Equation  , = 58,159 + 52t + 43.3t2
d. The actual population estimate for 2014 is 63,828. Which model does better? Why?
Definitions:
Learning Disabilities
A group of disorders characterized by significant difficulties in the acquisition and use of listening, speaking, reading, writing, reasoning, or mathematical abilities.
Motor Skill
The ability to perform movements with precision and coordination.
Newborn Sleep
A critical phase for infants characterized by long hours of sleep, necessary for development and growth.
Apgar Scale
An immediate assessment conducted on a newborn at 1 and 5 minutes post-birth to evaluate the infant's heart rhythm, breathing, muscle strength, reflexes, and skin pigmentation.
Q2: Solve the following equation for <img src="https://d2lvgg3v3hfg70.cloudfront.net/TB5596/.jpg"
Q5: Explain what 90% confidence means in this
Q9: True or False: There exists a natural
Q10: What does the limit <img src="https://d2lvgg3v3hfg70.cloudfront.net/TB5596/.jpg" alt="What
Q12: A company that manufactures health food snacks
Q18: The standard deviation of the number of
Q24: At α = 0.05,<br>A) we fail to
Q31: True or False: The graph of the
Q31: Below is the five-number summary of salaries
Q87: Evaluate the limit or state that it