Daily closing stock prices for Kyopera Corporation were obtained from August 3, 2016 through August 23, 2016 and appear in the time series graph below. 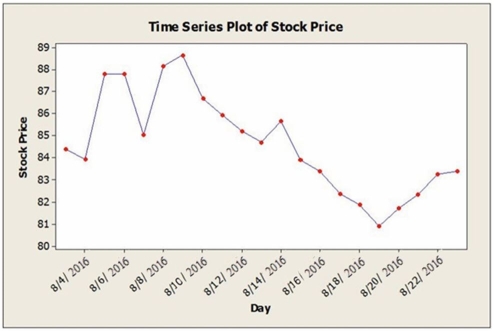 a. Identify the dominant time series component(s) in the data.
b. The method of moving averages was applied to these data. Below are time series graphs showing moving average results using two different values of L. In which application is a larger value of L used?
i. 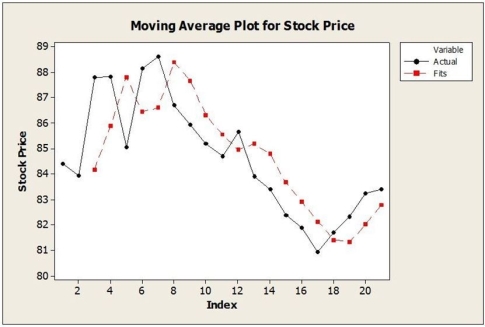 ii.
ii. 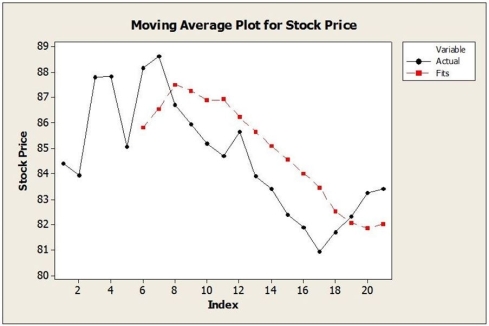 c. Suppose that the single exponential smoothing (SES) model was applied to these data. Below are time series graphs showing SES results using two different smoothing constants (α = 0.2 and α = 0.8). In which application is a larger value of α used?
i. 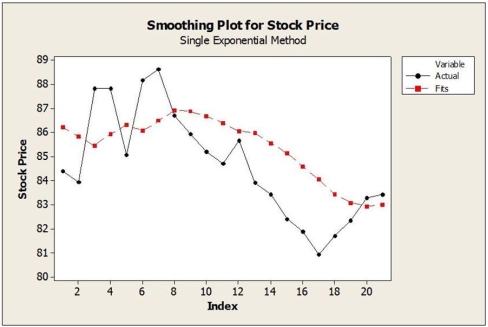 ii.
ii. 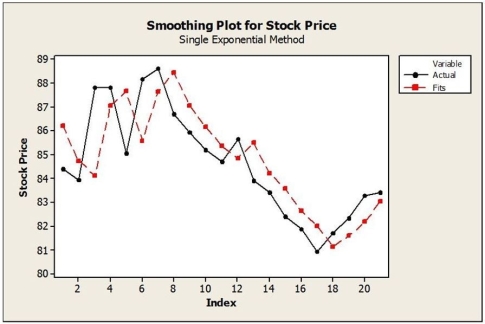
Definitions:
Q1: Which of the following statements about multiple
Q4: The correct null hypothesis is<br>A) mean vitamin
Q4: Below is a histogram of salaries (in
Q5: Suppose the resulting sample mean is 19.5
Q13: A pair of variables, x and y,
Q20: Find the smallest and the largest values
Q26: Which of the following statements are false?<br>A)
Q32: At the 0.05 level of significance, the
Q70: What is the equation of the tangent
Q73: Compute the following limits:<br>A) <img src="https://d2lvgg3v3hfg70.cloudfront.net/TB5596/.jpg" alt="Compute