Using data from the U.S. Bureau of the Census, the model 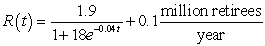 gives the projected rate of change in the number of people within one year of retirement, where t is the number of years since 1940, for the years between 1940 and 2050. Use the equation and ten midpoint rectangles to estimate, to four decimal places, the change in the population within one year of retirement or older from the end of 2037 through the end of 2042.
Definitions:
Q2: _ helps companies embrace the idea that
Q5: "Assault" is defined as the unauthorized and
Q6: Identify the correct statement about appellate jurisdiction.<br>A)
Q8: Define the various types of criminal offenses
Q8: What are the requirements for a real
Q9: According to the stakeholder theory, _.<br>A) when
Q13: Assume that s, r, and h are
Q13: Draw the contour curves <img src="https://d2lvgg3v3hfg70.cloudfront.net/TB6775/.jpg" alt="Draw
Q14: Consider the graph of f(t). <img src="https://d2lvgg3v3hfg70.cloudfront.net/TB6775/.jpg"
Q33: Locate and classify any critical points. <img