Suppose the graph shows the energy usage in megawatts for one day for a large university campus. The daily energy consumption for the campus is measured in megawatt-hours and is found by calculating the area of the region between the graph and the horizontal axis. Estimate, to the nearest 10 megawatt-hours, the daily energy consumption using four left rectangles. 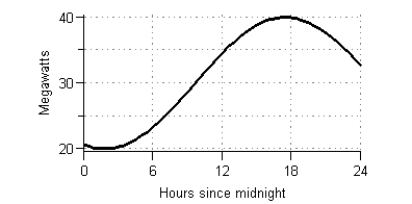
Definitions:
Q3: The court has created three classifications under
Q10: A travel agency offers spring-break cruise packages.
Q14: The function B gives the balance, in
Q17: Wally asks Eddie if he can store
Q18: The table below gives the normal daily
Q23: For a certain brand of bicycle, <img
Q24: Plant life is not considered to be
Q37: In the 1860s and 1870s Nevada experienced
Q38: Suppose the number of general aviation aircraft
Q60: Under the covenant of quiet enjoyment, a