Life Expectancy
An actuary wanted to develop a model to predict how long individuals will live.After consulting a number of physicians,she collected the age at death (y),the average number of hours of exercise per week (x1),the cholesterol level (x2),and the number of points that the individual's blood pressure exceeded the recommended value (x3).A random sample of 40 individuals was selected.The computer output of the multiple regression model is shown below. THE REGRESSION EQUATION IS y = 55.8 + 1.79x1− 0.021x2− 0.061x3 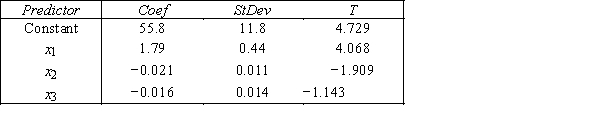 S = 9.47 R−Sq = 22.5% ANALYSIS OF VARIANCE
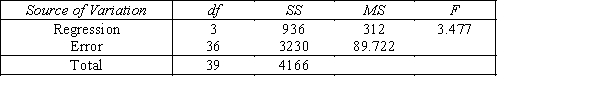
-{Life Expectancy Narrative} Is there enough evidence at the 5% significance level to infer that the cholesterol level and the age at death are negatively linearly related?
Definitions:
Exponential Distribution
A statistical distribution used to model time between events in a process that occurs continuously and independently at a constant average rate.
Poisson Distribution
A mathematical representation that quantifies the odds of various event frequencies occurring within a predetermined span of time or space.
Average Time
The mean time taken for a process or event, calculated by summing the total times recorded and dividing by the number of events.
Arrival Rate
In operations, it refers to the frequency at which tasks, customers, or entities arrive at a system or facility, typically measured in units per time period.
Q3: The test statistic for the chi-squared test
Q23: An organization undergoing significant going concern problems
Q44: Restrictions imposed by a client prohibited the
Q59: In a simple linear regression problem, the
Q65: If we use the <span
Q66: Predict with 90% confidence the selling price
Q91: In Fisher's least significant difference (LSD) multiple
Q117: How do you calculate the expected frequency
Q160: Interpret the value of the slope of
Q181: A random sample of 25 observations is