Oil Quality and Price
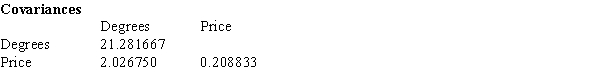
Quality of oil is measured in API gravity degrees--the higher the degrees API,the higher the quality.The table shown below is produced by an expert in the field who believes that there is a relationship between quality and price per barrel. 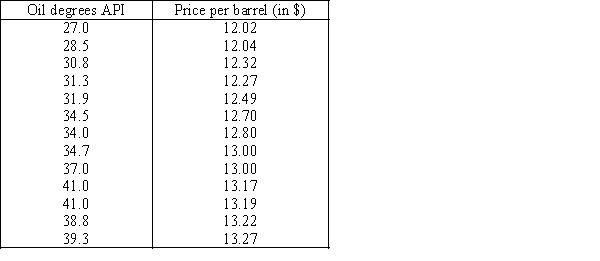 A partial Minitab output follows:
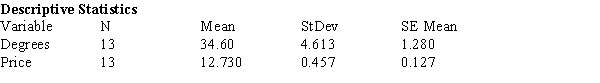
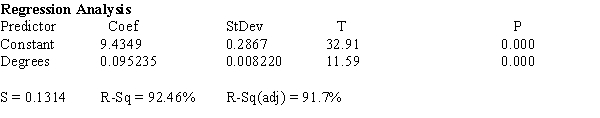
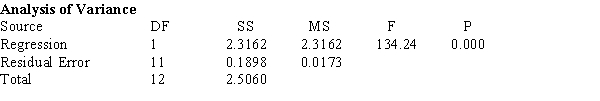
-{Oil Quality and Price Narrative} Determine the least squares regression line.
Definitions:
Bar Chart
A graphical representation of data using bars of varying heights or lengths to show the values across different categories.
Frequency Polygon
A graphical representation of the distribution of a dataset that uses lines connecting points representing the frequencies of respective values.
Initial Understanding
The foundational or basic comprehension of a concept, phenomenon, or situation before further, deeper learning takes place.
Dependent Variables
Variables in an experiment that are expected to change as a result of changes made to the independent variables.
Q34: If multicollinearity exists among the independent variables
Q55: In employing the randomized block design, the
Q67: A race car driver tested his car
Q68: The test for the equality of two
Q85: A Deli proposes to serve 4
Q112: A scatter diagram includes the following data
Q115: A chi-squared test of a contingency table
Q116: The confidence interval estimate of the expected
Q135: A regression line using 25 observations produced
Q187: What other variables might be associated with