A phase portrait of a predator-prey system is given below in which F represents the population of foxes (in thousands) and R the population of rabbits (in thousands). 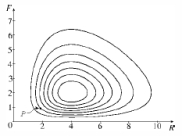 (a) Referring to the graph, what is a reasonable non-zero equilibrium solution for the system?
(b) Write down a possible system of differential equations which could have been used to produce the given graph.(c) Describe how each population changes as time passes, using the initial condition P indicated on the graph.(d) Use your description in part (c) to make a rough sketch of the graph of R and F as functions of time.
Definitions:
Market Growth Rate
The increase in size or value of a market over a specified period, typically expressed as a percentage.
Demand Curve
A graphical representation showing the relationship between the price of a product and the quantity of the product that consumers are willing to purchase.
Parabola
A symmetrical, open plane curve formed by the intersection of a cone with a plane parallel to its side.
Diagonal Line
A line segment that joins two non-adjacent vertices in a polygon or two vertices in a polyhedron that are not on the same face, often creating a sense of movement in artwork or design.
Q20: Suppose that we model populations of
Q54: Let <span class="ql-formula" data-value="f (
Q63: A tank contains water. The end of
Q80: (a) Solve the differential equation
Q100: Find a parametric equation of the line
Q116: How many terms of the alternating
Q151: What is the smallest value of
Q167: Find the area of the shaded region:
Q174: Given three points P(1, -1, 0),
Q207: Find the value of the integral