Essay
(a) Explain why the function defined by the graph below is a probability density function. 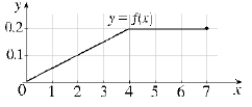 (b) Use the graph to find the following probabilities:
(i) (ii) (c) Calculate the median for this distribution.
Definitions:
Related Questions
Q25: Suppose a population growth is modeled
Q33: The base of a certain solid
Q79: In 1970, the Brown County groundhog population
Q82: Which of the following series is
Q83: Determine whether the given series is
Q105: Evaluate the following integrals:<br>(a) <span
Q121: Find the limit of the sequence
Q143: A bacteria culture starts with 200 bacteria
Q191: A scientist collects the following data
Q199: Determine whether the given series is