Essay
Given the graph below, use 5 rectangles to estimate the area under the graph from x = 0 to x = 5. Compute L5 (sample points are left endpoints), R5 (sample points are right endpoints) and M5 (sample points are midpoints). Which of the estimates appears to give the best estimate? Justify your answer. 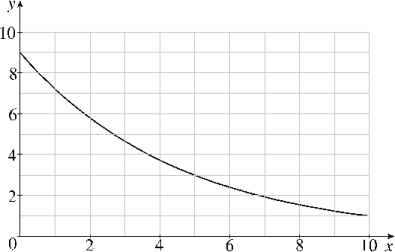
Definitions:
Related Questions
Q7: Find the minimum value of the
Q45: Compute <span class="ql-formula" data-value="\frac {
Q83: Find the length of the curve
Q132: If <span class="ql-formula" data-value="\int _
Q137: Use Newton's method to find
Q145: Let f (x) = <span
Q173: Find the average value of the
Q187: If <span class="ql-formula" data-value="g (
Q188: Use Definition 2 to show that
Q193: Find the value of the integral