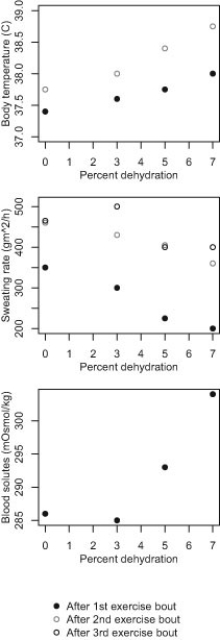
Scientists studied the thermoregulatory and osmoregulatory responses in exercising human subjects who were experiencing different levels of dehydration (0%, 3%, 5%, and 7% based on body weight) . After exercise, the subjects' body temperatures, sweating rates, and blood solute concentrations were measured. Their results are shown in these three graphs. Note that only sweating rate was measured after each bout of exercise. Body temperature was measured after the first two bouts of exercise, and blood solutes after only the first bout of exercise.
 Source: Adapted from Sawka, M. N., Young, A. J., Francesconi, R. P., Muza, S. R., & Pandolf, K. B. (1985) . Thermoregulatory and blood responses during exercise at graded hypohydration levels. J Appl Physiol, 59, 1394-1402.
-Which of the following homeostatic mechanisms is demonstrated in the graph of blood solutes?
Definitions:
Deviations
Differences between observed values and some reference value, often the mean of the dataset, indicating the spread of the data.
Mean Squared
A statistical measure of the average of the squares of the errors or deviations, that is, the difference between the estimator and what is estimated.
Standard Deviation
A measure of the amount of variation or dispersion in a set of values.
Spread Out
Describes data that is dispersed widely, showing a large variation among its values, often seen in distributions with high variance.
Q13: Functionally, the muscle fiber's fundamental unit of
Q16: In a water molecule, hydrogen and oxygen
Q16: Which of the following statements about red
Q19: The first step in the formation of
Q32: Oxygen is mostly transported through the body
Q43: Why must water that has moved to
Q46: Which of the following is widely regarded
Q51: What anatomical changes do you expect to
Q59: A single PR protein is composed of
Q61: The embryo normally implants in the<br>A) oviduct.<br>B)