To evaluate cardiac function, scientists and physicians measure both the pressure and the volume inside the heart. When both pressure and volume data are plotted on the same graph, the resulting graph is called a pressure-volume loop. To create a pressure-volume loop, a catheter (a thin tube) is inserted into the vessels of the heart, and measurements of both left ventricular pressure and left ventricular volume are taken. The data are plotted on a graph, and cardiac function can then be evaluated from the distribution of the data and the shape of the loop.
The following figure shows a typical left ventricle pressure-volume loop for a healthy young adult. The cardiac cycle proceeds counterclockwise. Each complete turn around the loop (for example, starting at point A and ending back at point A) represents one complete cardiac cycle.
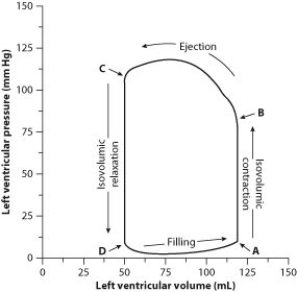
-Aortic stenosis is a disease in which the aortic valve (the semilunar valve between the left ventricle and the aorta) narrows, resulting in increased left ventricular pressure and reduced ejection volume (the amount of blood that the left ventricle ejects) . What would the pressure-volume graph for a patient with aortic stenosis look like compared to the graph shown above for a healthy young adult?
Definitions:
Merchandiser
A person or company involved in the business of purchasing goods and selling them at retail or wholesale.
Net Income
The income a company ultimately makes after all operational costs and taxes are deducted from revenue.
Buying and Selling Merchandise
The process of purchasing goods to resell at a higher price, typically found in retail or wholesale businesses.
Revenue Recognition Rules
guidelines that determine when and how revenue is recognized and recorded in the financial statements.
Q1: What is the main evidence that you
Q2: Ferns and mosses are similar because both<br>A)
Q16: Through chemical digestion, nucleic acids are broken
Q26: Which statement about Alzheimer's disease is true?<br>A)
Q27: Which of the following organisms has a
Q29: There was a third group (group 3)
Q39: In ocean acidification, dissolving CO<sub>2</sub> gas _
Q45: Which statement about this figure is true?
Q68: Which of the following correctly lists the
Q71: At what point on the diagram does