Please use the following information to answer the question(s) below.
The eight climographs in Figure 40.1 show yearly temperature (line graph and left vertical axis) and precipitation (bar graph and right vertical axis) averages for each month for some locations on Earth.Choose the climograph that best answers the question.
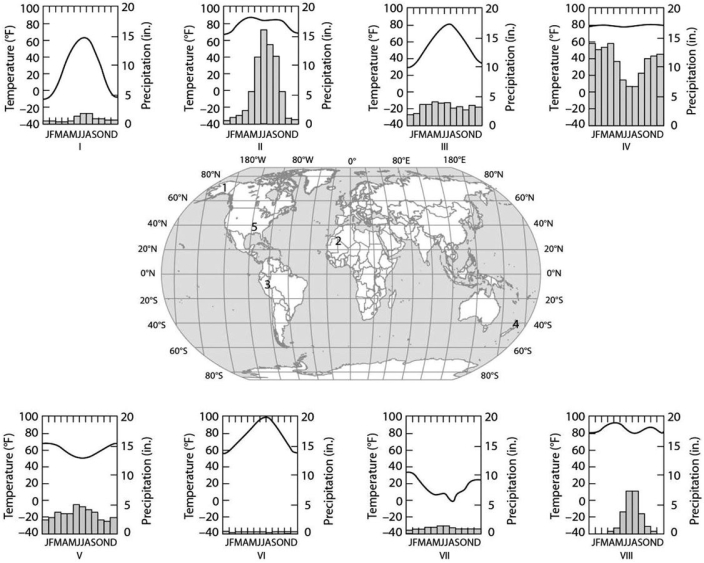 Figure 40.1
-Which climograph shows the climate for location 2?
Definitions:
Break-Even Point
The point at which total costs and total revenue are equal, resulting in no net loss or gain.
Variable Cost
Expenses in a business operation that fluctuate with the level of output, such as materials and labor costs.
Utilization
The degree to which a resource, such as equipment or labor, is being used effectively to produce goods or services.
Efficiency
A measure of how well resources (time, energy, costs) are used to achieve a goal or perform a process with minimal waste or effort.
Q1: The biological hypothesis for your experiment is
Q5: A newspaper ad for a local toy
Q15: According to the logistic growth equation<br>[&*frac*{dN}{dt}|=|rN|thn|*frac*{(K|-|N)}{K}&]<br>A) the
Q24: A graded hyperpolarization of a membrane can
Q26: In the human retina<br>A) cone cells can
Q57: If you applied a fungicide to a
Q57: Clonal selection implies that<br>A) brothers and sisters
Q61: How should the scientist draw a graph
Q66: Which zone produces the most global oxygen?<br>A)
Q71: In sea urchins, the "fast block" and