Which graph best describes how the vapor pressure of a substance varies with temperature according to the Clausius-Clapeyron equation? ln(P) is plotted on the y-axis, and 1/T is plotted on the x-axis. The origin (0, 0) is not necessarily located where the axes cross. 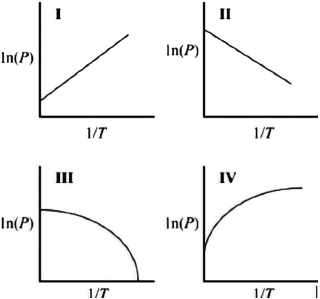
Definitions:
Education
The process of receiving or giving systematic instruction, especially at a school or university.
Social Exchange Theory
A psychological and sociological theory that explains social change and stability as a process of negotiated exchanges between parties.
Social Interaction
The process by which individuals act and react in relation to others in a societal context.
Rational Balancing
The process of making decisions by weighing the benefits and costs of various options in a logical and analytical manner.
Q10: One mole of solid ammonium carbamate (NH<sub>4</sub>CO<sub>2</sub>NH<sub>2</sub>)
Q16: A student determined the equilibrium concentration in
Q45: The sulfide ion, S<sup>2</sup><font face="symbol"><sup></sup></font>, reacts with
Q46: Explain why the boiling point of nitrogen
Q55: NO<sub>2</sub> concentrations during photochemical smog events often
Q88: Copper crystallizes in a face-centered cubic pattern.
Q110: For the series methane, ammonia, and water,
Q127: A newspaper article suggested using a fertilizer
Q151: Sodium hypochlorite (NaClO) is used as a
Q164: What is the molecular geometry around a