Which graph best describes how the vapor pressure of a solution varies according to Raoult's law as a nonvolatile solute is added to a liquid? The vapor pressure of the solution is plotted on the y-axis, and the mole fraction of solute is plotted on the x-axis. The origin (0, 0) is not necessarily located where the axes cross. 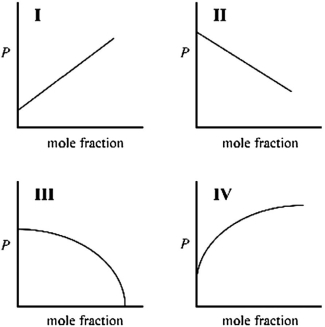
Definitions:
Pricing Model
A Pricing Model is a strategy or formula used to determine the best price for a product or service, based on factors such as cost, competition, and value to the customer.
ESOs
Employee Stock Options are options granted to employees as part of their compensation package, allowing them to purchase company stock at a set price.
Vesting Period
The period of time before employees earn non-forfeitable rights over employer contributions made to the employee's pension plan or stock option plan.
Up To Three Years
A phrase indicating a time frame or duration that does not exceed three years.
Q24: Which statement A-D regarding semiconductors is not
Q49: Identify whether or not perturbations A-D will
Q56: What type of hybridization is needed to
Q81: Which electron-pair geometry corresponds to a steric
Q84: An approximately spherical allotrope of carbon containing
Q109: Which statement about <font face="symbol"></font>and <font face="symbol"></font>bonds
Q111: Which of the following molecules has a
Q117: Which of the following diagrams best shows
Q137: You are working as an intern in
Q152: Which of the following substances has a