Which graph best describes how the vapor pressure of a solution varies according to Raoult's law as a nonvolatile solute is added to a liquid? The vapor pressure of the solution is plotted on the y-axis, and the mole fraction of solvent is plotted on the x-axis. The origin (0, 0) is not necessarily located where the axes cross. 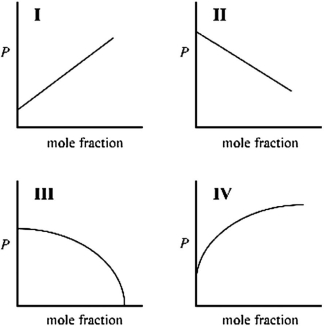
Definitions:
Promote or Demote
Terms used in hierarchical structures or lists to move an item to a higher or lower level of importance or rank.
Subdocument
A subordinate document linked or incorporated into a main document, allowing for easier management and organization of complex documents.
Outline View
A feature in many software applications that displays documents or projects as structured summaries, often showing headings and subheadings in a hierarchical format.
Show First Line Only
A feature in applications that limits the display to the first line of a text block or entry, used to manage screen space or preview content.
Q3: Which of these materials is the best
Q3: Which alkane compound has the highest vapor
Q6: The concentration of acetic acid in vinegar
Q17: In a first-order reaction, the initial concentration
Q20: A covalent bond results when _<br>A)electrons are
Q41: For the following reaction, K<sub>p</sub> = 137
Q64: Which statement regarding the formation of an
Q82: Iron (Fe) crystallizes as a body-centered unit
Q120: If half of the tetrahedral holes in
Q125: Which electron-pair geometry has the lowest electron-electron