Multiple Choice
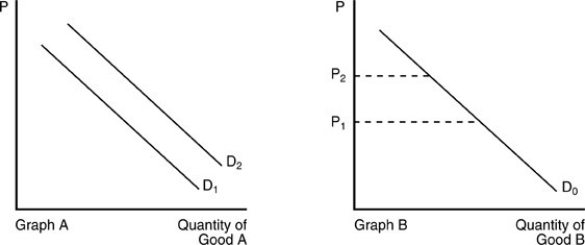
-In the above figure, the demand curve for Good A shifts from D1 to D2 in Graph A when the price of Good B changes from P1 to P2 in Graph B. We can conclude that
Definitions:
Related Questions
Q26: When the price of a good falls,there
Q80: Refer to the above figure.The market clearing
Q123: When the price of a complement (cream)decreases,the
Q191: An import quota specifies<br>A)the amount of funds
Q202: According to the law of demand,an increase
Q204: Consider a world with two countries and
Q246: Suppose economic stability in the United States
Q283: Which of the following is an advantage
Q294: Extremely cold winter weather has destroyed oranges
Q299: Refer to the above figure.If the farmer