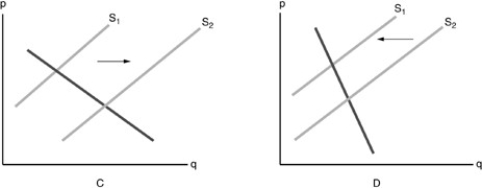
-Refer to the above figure. Corn is an input for producing Corn Flakes. Which diagram shows the effect on the supply of Corn Flakes when the price of corn has increased?
Definitions:
Output
The amount of goods or services produced by a person, machine, factory, country, etc.
Marginal Cost Curve
A graph that displays the cost of producing each additional unit, typically showing how marginal cost changes as production increases.
Average Total Cost (ATC)
The total cost of production divided by the quantity of output produced, representing the per unit cost of production.
Average Variable Cost (AVC)
The total variable costs of production (like labor and material costs) divided by the quantity of output produced, indicating the average variable expense per unit of output.
Q19: The contention that domestic unions tend to
Q61: The shape of the production possibilities curve
Q123: When the price of a complement (cream)decreases,the
Q182: The accumulated training and education that you
Q279: Production is efficient when<br>A)it generates a point
Q282: Which of the following illustrates the law
Q330: A market demand schedule for a product
Q336: In the above figure,the combination of personal
Q367: How is economic growth shown by the
Q410: What happens as the result of a