Essay
For the following data, construct a graph showing the probability distribution. 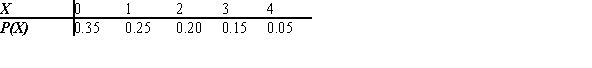
Definitions:
Related Questions
Q6: If there are 4 means to be
Q13: A distribution in which approximately 68% of
Q23: A random group of students was selected
Q24: A certain system has two components. There
Q34: Find the area under the standard normal
Q45: The average resident of Metro City produces
Q65: A retailer wants to estimate with 99%
Q78: How many different ways can a teacher
Q145: With regard to characteristics of a good
Q163: _ may be more difficult for a