Examlex

Solved

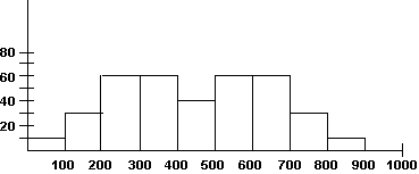
Given the Histogram Below, Which Statement Is True

question 46

Multiple Choice

Given the histogram below, which statement is true? Given the histogram below, which statement is true?   A)  The histogram has an outlier between 400 and 500. B)  The histogram is skewed to the right. C)  The histogram is symmetric. D)  The histogram has a gap between 400 and 500.


Definitions:

Regression Model

A statistical approach for estimating the relationships among variables, often used for prediction and forecasting.

Dummy Variables

Variables created to assign numerical values to categorical data, often used in regression analysis to include qualitative factors as independent variables.

Qualitative Variables

Variables that categorize or describe attribute characteristics without a natural numerical order or ranking.

Regression Model

A mathematical model that describes the relationship between a dependent variable and one or more independent variables.

Related Questions