Multiple Choice
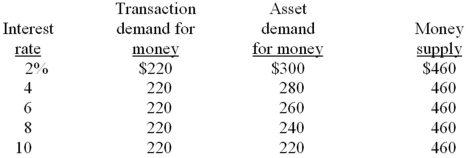
-Refer to the graph below, in which Dt is the transactions demand for money, Dm is the total demand for money, and Sm is the supply of money. If the market for money is in equilibrium at a 6 percent rate of interest and the money supply increases, then Sm2 will shift to: 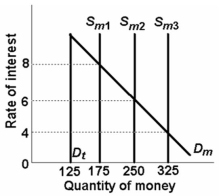
Definitions:
Related Questions
Q44: The Laffer Curve shows the real world
Q50: The terms of trade reflects the:<br>A) rate
Q52: Refer to the above diagram. The initial
Q56: Refer to the graph below. The effects
Q64: Refer to the graph below. The economy
Q122: Refer to the above data. In 2008
Q145: Other things equal, an expansionary monetary policy
Q159: Refer to the above diagram pertaining to
Q244: Refer to the above market for money
Q249: Demand deposits are:<br>A) included in M1 but