Exhibit 3.5
The following questions are based on this problem and accompanying Excel windows.
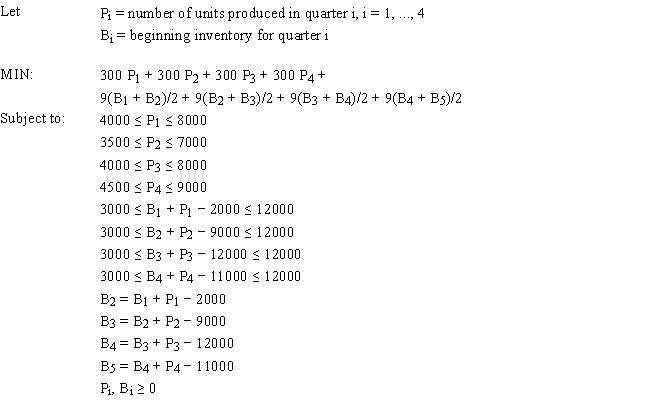
A company is planning production for the next 4 quarters. They want to minimize the cost of production. The production cost is stable but demand and production capacity vary from quarter to quarter. The maximum amount of inventory which can be held is 12,000 units and management wants to keep at least 3,000 units on hand. Quarterly inventory holding cost is 3% of the cost of production. The company estimates the number of units carried in inventory each month by averaging the beginning and ending inventory for each month. There are currently 5,000 units in inventory. The company wants to produce at no less than one half of its maximum capacity in any quarter. 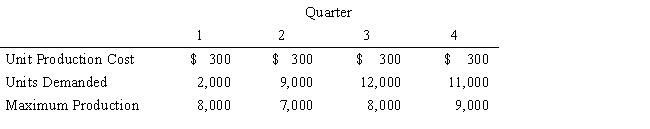
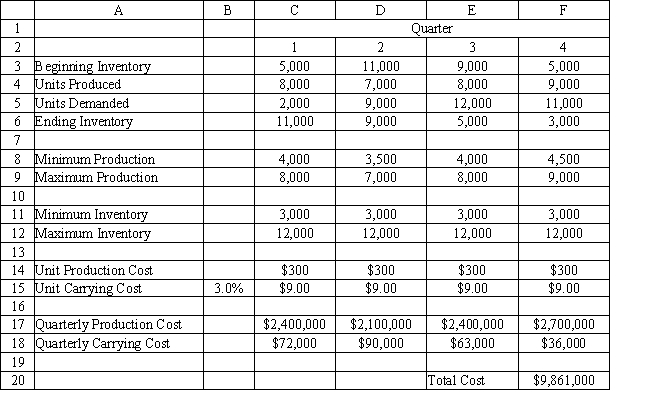
-Refer to Exhibit 3.5. What formula could be entered in cell F20 in the accompanying Excel spreadsheet to compute the Total Cost for all four quarters?
Definitions:
Information Overload
Exposure to an overwhelming amount of information.
Electronic Communication
The transmission of information using electronic means such as email, text messages, and social media.
Text Message
A form of electronic communication where short messages are sent over cellular networks between mobile devices.
Verbal
Pertaining to words, either spoken or written, as a means of communication or expression.
Q4: ILP formulations can be used to model:<br>A)
Q7: Which of the following is the type
Q8: Refer to Exhibit 7.1. What formula goes
Q10: Deviational variables<br>A) are added to constraints to
Q29: The decisions in an optimization problem are
Q44: Multi-objective linear programming (MOLP) provide<br>A) a way
Q78: Good decisions always result in good outcomes.
Q78: Which of the following best describes the
Q92: The term dollar votes means:<br>A) inflation will
Q200: Answer on the basis of the relationships