A company makes products A and B from 2 resources, labor and material. The company wants to determine the selling price which will maximize profits. A unit of A costs 30 to make and demand is estimated to be 50 − .09 * Price of A. A unit of B costs 20 to make and demand is estimated to be 30 − .14 * Price of B. The utilization of labor and materials and the available quantity of resources is shown in the table. A reasonable price for the products is between 90 and 140. 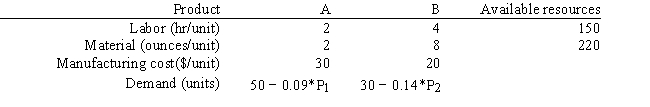 Let X1 = demand for As and X2 = demand for Bs.
Let P1 = price for As and P2 = price for Bs.
Formulate the NLP for this company
Definitions:
Simple Linear Regression
a statistical method that models the relationship between a dependent variable and one independent variable using a linear equation.
Regression Model
A statistical model that estimates the relationship between a dependent variable and one or more independent variables.
Regression Analysis
A statistical technique used to model and analyze the relationship between a dependent variable and one or more independent variables.
Positively Skewed
A distribution shape where the right tail (higher values) is longer, indicating that the mean and median are greater than the mode.
Q3: A company has recorded the following list
Q11: Project 5.2 − Small Production Planning Project<br>(Fixed
Q16: Refer to Exhibit 11.22. What is the
Q26: The setup cost incurred in preparing a
Q32: In a maximization problem, the GRG algorithm's
Q36: What needs to be done to the
Q39: Which property of network flow models guarantees
Q47: Refer to Exhibit 9.1. Interpret the meaning
Q54: An investor wants to determine how much
Q87: Most of the other types of network