Exhibit 12.5
The following questions use the information below.
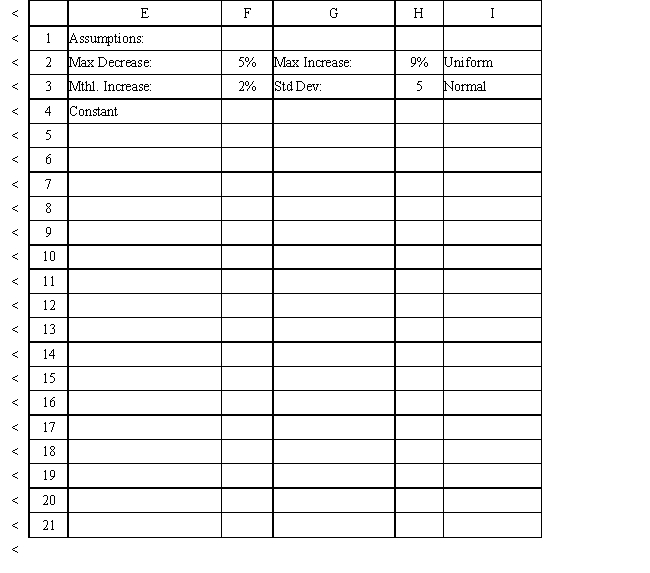
The owner of Sal's Italian Restaurant wants to study the growth of his business using simulation. He is interested in simulating the number of customers and the amount ordered by customers each month. He currently serves 1000 customers per month and feels this can vary uniformly between a decrease of as much as 5% and an increase of up to 9%. The bill for each customer is a normally distributed random variable with a mean of $20 and a standard deviation of $5. The average order has been increasing steadily over the years and the owner expects the mean order will increase by 2% per month. You have created the following spreadsheet to simulate the problem. 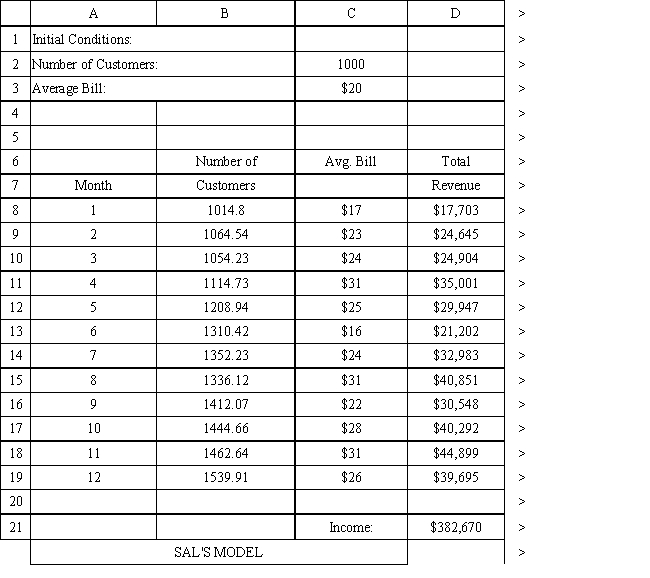
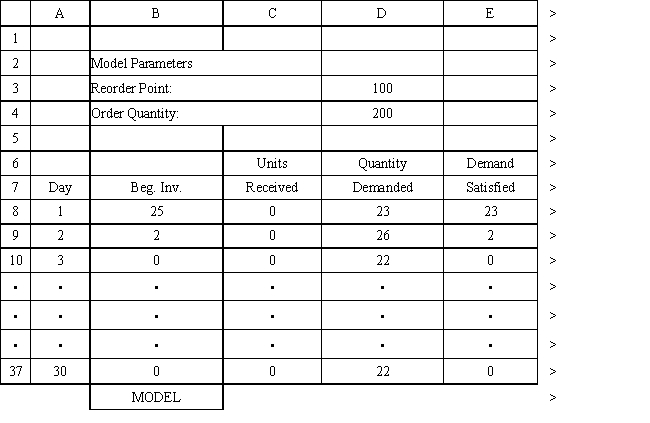
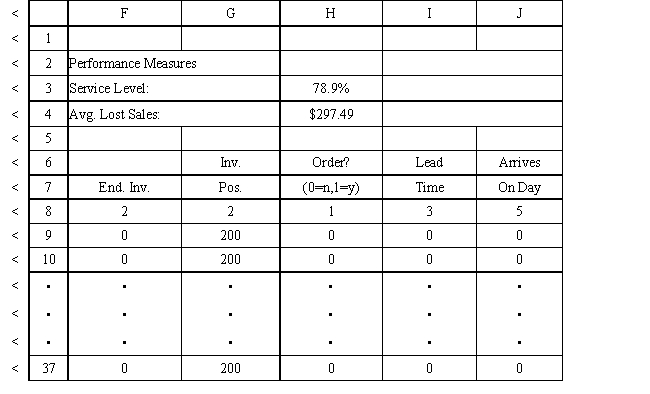
-An office supply store wants to simulate its inventory system for notebooks. The company has collected data on the shipping time and daily demand for notebooks. Each notebook generates a $2 profit. Customers can buy notebooks at any office supply store so there are no backorders (the company loses the sale and profit). The company orders 200 notebooks whenever the inventory position falls below the reorder point of 100 notebooks. Orders are placed at the beginning of the day and delivered at the beginning of the day so the notebooks are available on the arrival day. The average daily demand is 23.5 notebooks. An average service level of 99% is desired. There are currently 25 notebooks on hand and no orders are pending. The following spreadsheets have been developed for this problem. The company has simulated 1 month of operation for its inventory system. (HINT: This covers Rows 8 to 37 of the spreadsheet.) What formulas go in cells A1:J37 of the "Model" worksheet for this simulation? 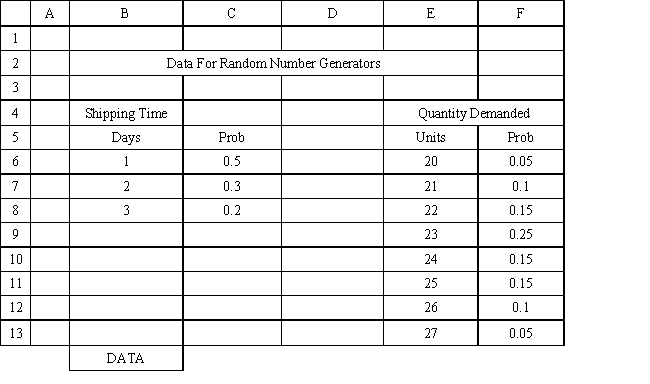
Definitions:
Quantitative Data
Numerical information that can be measured and quantified, allowing for statistical analysis and mathematical calculations.
Relative Frequency Distribution
A relative frequency distribution is a type of frequency distribution that shows the proportion or percentage of observations within each category or interval.
Histogram Form
A graphical representation showing a visual impression of the distribution of data, using bars of different heights.
Frequency Histogram
A graphical representation of data that shows the number of observations within specified intervals.
Q6: Refer to Exhibit 14.9. What formula should
Q10: Refer to Exhibit 11.6. What formula should
Q36: Improvements in the criminal justice system related
Q44: Burning a cross on the lawn of
Q54: Using the information in Exhibit 12.3, what
Q60: Refer to Exhibit 8.2. The company wishes
Q69: A time series is a set of
Q87: The main difference between LP and NLP
Q94: Which are characteristics of decision-making under uncertainty?<br>A)
Q108: The _ in a decision problem represent